You have skipped the navigation, tab for page content
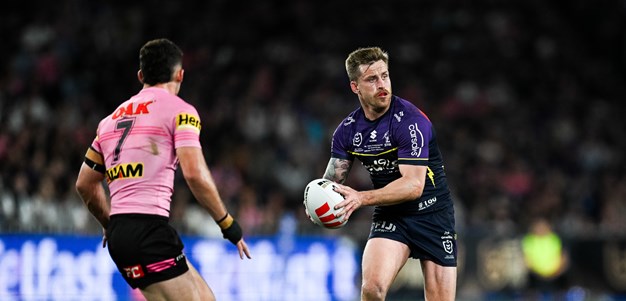
Cameron Munster Profile Image

Cameron Munster

Five-Eighth

Storm

Player Bio

Height:
185 cm
Date of Birth:
13 September 1994
Weight:
89 kg
Birthplace:
Rockhampton, QLD
Age:
30
Nickname:
Munny
Debut Club:
Melbourne Storm
Date:
31 May 2014
Opposition:
North Queensland Cowboys
Round:
12
Previous Club:
-
Junior Club:
Norths Knights
Biography:

One of the most exciting play makers in the comp, Munster has been giving opposition defensive lines headaches since first pulling on the purple jersey in the 2014 season.

After earning Melbourne Storm Player of the Year honours for the 2022 season, Munster continued his strong form in season 2023, scoring eight tries and registering 15 try assists in his 22 appearances.

A proud Queenslander, Munster has also been a mainstay in the Maroon jumper, making 18 State of Origin appearances and receiving numerous Man of the Match and Man of the Series honours.

He’s also been a force on the international stage, representing Australia 11 times and starting at five-eighth in Australia’s 2021 Rugby League World Cup winning side.

Munster was announced as Vice-Captain alongside halves partner Jahrome Hughes for the 2024 season.

A proud 'One-Club Man', Munster has signed to remain in the purple jersey until the end of the 2027 season

Cameron is sponsored by P.R.E Solutions, Jen Campbell, Stow Australia and Down Under Turf.

Career

Appearances
212
Tries
59

2024 Season

Appearances
17

Scoring

Tries
5

Kicking

Forced Drop Outs
5
Average Kicking Metres
123.2

Attack

Try Assists
12
Line Break Assists
10

Passing

Offloads
15
Receipts
761

Defence

Tackles Made
323
Tackle Efficiency

Running Metres

Average Running Metres
123
Total Running Metres
2092

Fantasy

Total Points
809
Average Points
47.6

2024 Season - By Round

Round Opponent Score Position Minutes Played Tries Goals 1 Point Field Goals 2 Point Field Goals Points Kicking Metres Forced Drop Outs Try Assists Linebreaks Tackle Breaks Post Contact Metres Offloads Receipts Tackles Made Missed Tackles Total Running Metres Hit Up Running Metres Kick Return Metres
5 Broncos Won 34 - 32 Five-Eighth 80 - - - - - 78 - - - 2 22 - 48 27 3 131 - 7
6 Bulldogs Won 16 - 14 Five-Eighth 80 - - - - - 226 1 1 - 4 52 - 60 23 5 149 - 2
7 Roosters Won 12 - 18 Five-Eighth 70 - - - - - 77 - 1 - 4 35 1 40 12 2 108 - -
8 Rabbitohs Won 54 - 20 Five-Eighth 80 1 - - - 4 187 - 4 1 9 40 - 35 22 2 127 - 3
9 Titans Won 20 - 22 Five-Eighth 80 1 - - - 4 125 - - - 1 25 - 41 30 7 106 - 21
10 Sharks Lost 18 - 25 Five-Eighth 80 - - - - - 161 - 2 - 1 20 2 61 17 2 65 - -
11 Eels Won 48 - 16 Five-Eighth 40 - - - - - 155 - - - 1 8 - 23 13 1 30 - -
21 Eels Won 14 - 32 Interchange 50 - - - - - 96 - - - - 19 1 27 18 5 72 47 6
22 Dragons Lost 16 - 18 Five-Eighth 80 - - - - - 61 - 1 1 3 57 1 42 18 3 177 - -
23 Rabbitohs Won 16 - 28 Five-Eighth 80 - - - - - 72 1 - - 3 28 - 47 23 3 126 - 14
24 Panthers Won 22 - 24 Five-Eighth 69 - - - - - 170 - 1 - 2 57 1 36 13 3 146 - -
25 Dolphins Won 48 - 6 Five-Eighth 67 - - - - - 20 - - 1 3 32 1 32 12 - 114 11 -
26 Cowboys Lost 38 - 30 Five-Eighth 80 - - - - - 233 1 2 - 3 21 3 57 20 2 79 - -
27 Broncos Won 12 - 50 Five-Eighth 80 - - - - - 34 1 - - 3 36 2 48 21 1 107 - 10
28 Sharks Won 37 - 10 Five-Eighth 80 1 - - - 4 187 1 - 1 7 49 1 53 14 1 182 - -
30 Roosters Won 48 - 18 Five-Eighth 80 2 - - - 8 51 - - 3 6 48 - 45 20 4 185 7 -
31 Panthers Lost 6 - 14 Five-Eighth 80 - - - - - 161 - - - 3 59 2 66 20 3 181 - 6

Career By Season

Career By Season
Year Played Won Lost Drawn Win % Tries Goals 1 Point Field Goals 2 Point Field Goals Points Kicking Metres Kicking Metres Average Goal Conversion Rate Forced Drop Outs Try Assists Offloads Receipts Tackles Made Missed Tackles Tackle Efficiency Total Running Metres Average Running Metres Kick Return Metres Total Points Average Points
Storm 2014 1 - 1 - - - - - - - - - - - - - 28 8 1 80.00% 156 156.00 98 11 11.0
Storm 2015 19 10 9 - 53% 7 - - - 28 200 10.52 - 5 5 10 590 99 23 81.15% 3,349 176.00 1,065 865 45.5
Storm 2016 24 19 5 - 79% 4 - - - 16 278 11.60 - 2 12 18 785 143 31 78.93% 3,843 160.00 1,236 1,143 47.6
Storm 2017 21 19 2 - 90% 1 12 - - 28 1,103 52.51 52.17% 4 13 31 595 419 53 88.77% 2,229 106.00 233 1,021 48.6
Storm 2018 24 16 8 - 67% 4 2 - - 22 2,972 123.83 100.00% 7 15 21 880 459 74 86.12% 2,426 101.00 186 1,079 45.0
Storm 2019 24 18 6 - 75% 8 2 - - 36 4,677 194.88 50.00% 11 15 13 1,103 537 76 87.60% 2,369 98.00 90 1,261 52.5
Storm 2020 18 16 2 - 89% 4 6 1 - 29 3,047 169.29 75.00% 7 8 18 755 381 59 86.59% 1,717 95.00 32 874 48.6
Storm 2021 20 16 4 - 80% 7 16 - - 60 4,657 232.86 53.33% 13 13 31 1,068 409 70 85.39% 2,260 113.00 76 1,218 60.9
Storm 2022 22 14 8 - 64% 11 7 - - 58 4,496 204.35 58.33% 9 16 34 1,094 346 61 85.01% 3,199 145.00 271 1,341 61.0
Storm 2023 22 14 8 - 64% 8 1 1 - 35 5,206 236.64 50.00% 7 15 28 1,182 448 90 83.27% 2,771 125.00 121 1,167 53.0
Storm 2024 17 13 4 - 76% 5 - - - 20 2,094 123.18 - 5 12 15 761 323 47 87.30% 2,092 123.00 73 809 47.6

Career Overall

Career Overall
Year Start Year End Played Won Lost Drawn Win % Tries Goals 1 Point Field Goals 2 Point Field Goals Points Kicking Metres Kicking Metres Average Goal Conversion Rate Forced Drop Outs Try Assists Offloads Receipts Tackles Made Missed Tackles Tackle Efficiency Total Running Metres Average Running Metres Kick Return Metres Total Points Average Points
Storm 2014 2024 212 155 57 - 73% 59 46 2 - 332 28,730 135.52 56.79% 70 124 219 8,841 3,571 585 85.92% 26,405 124.00 3,486 10,787 50.9

Latest

Team Mates

Acknowledgement of Country

Melbourne Storm respect and honour the Traditional Custodians of the land and pay our respects to their Elders past, present and future. We acknowledge the stories, traditions and living cultures of Aboriginal and Torres Strait Islander peoples on the lands we meet, gather and play on.